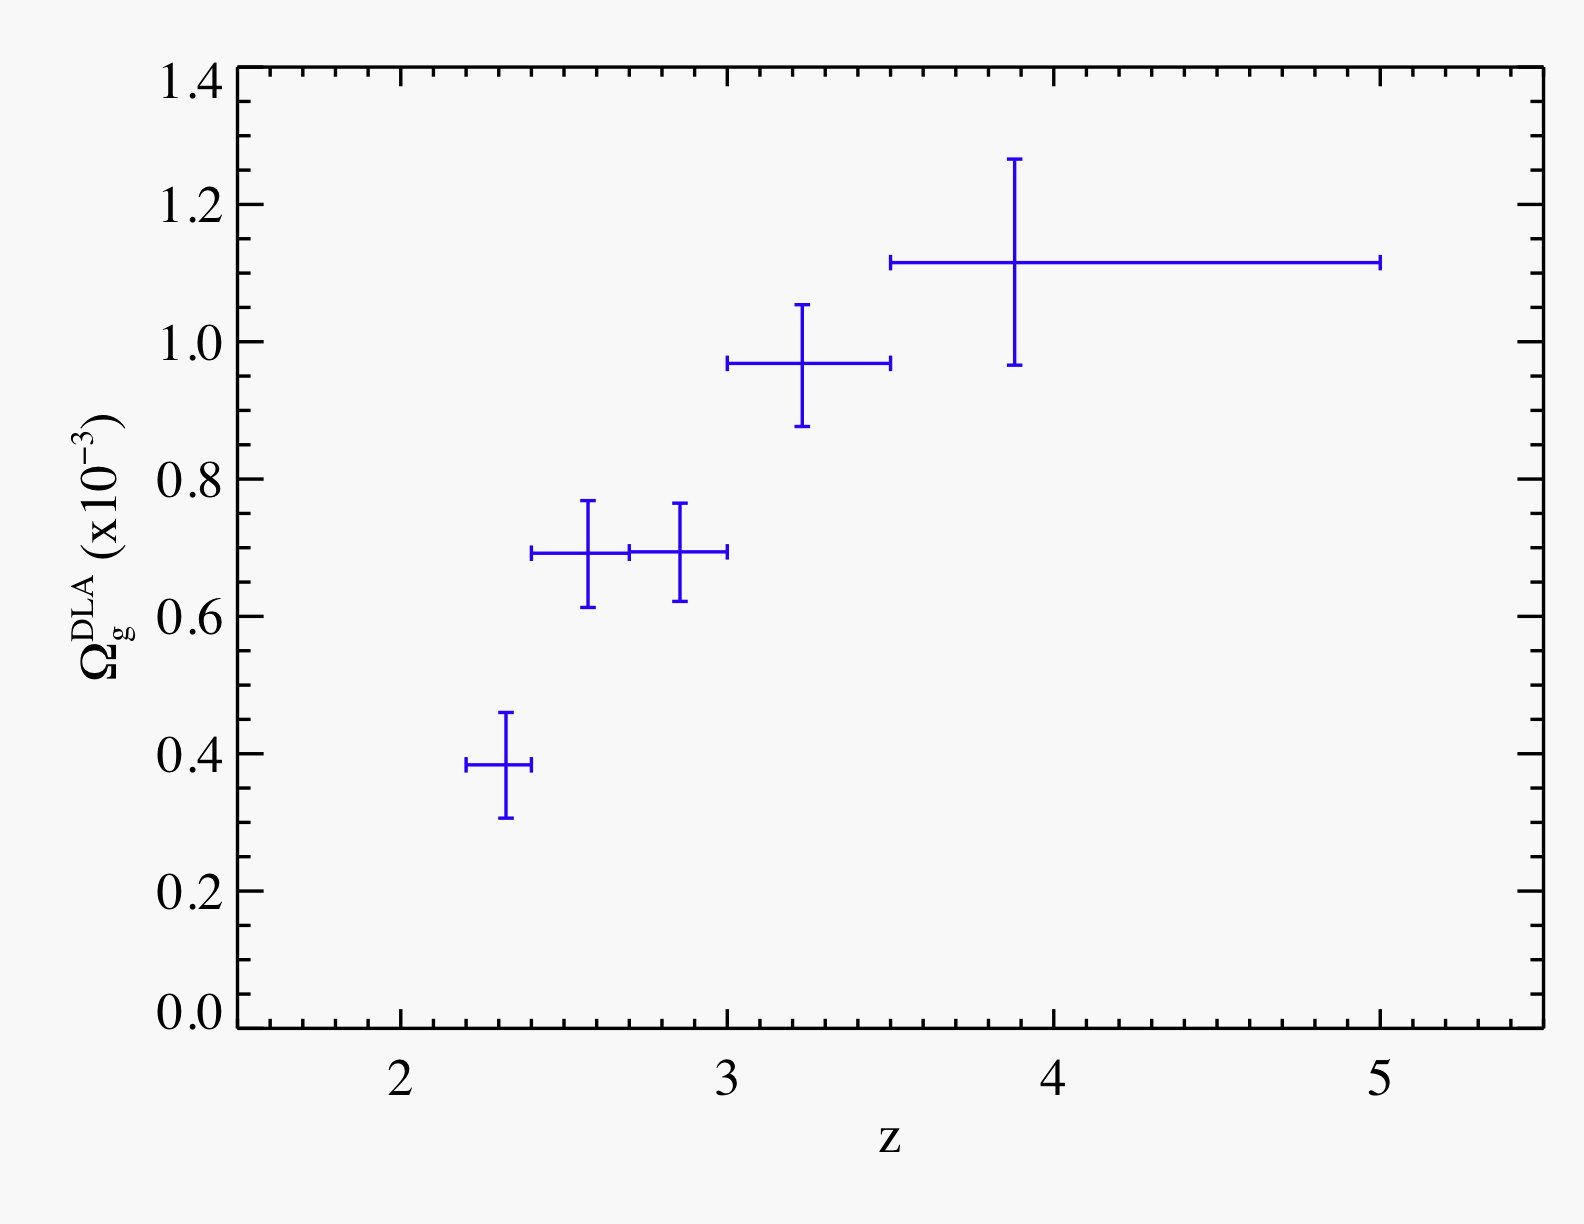
Figures from the DR5 SDSS-DLA Survey

This page provides a few figures from analysis of the DLA in the SDSS DR5. If you don't find what you are looking for, please request more.


Figure

Caption

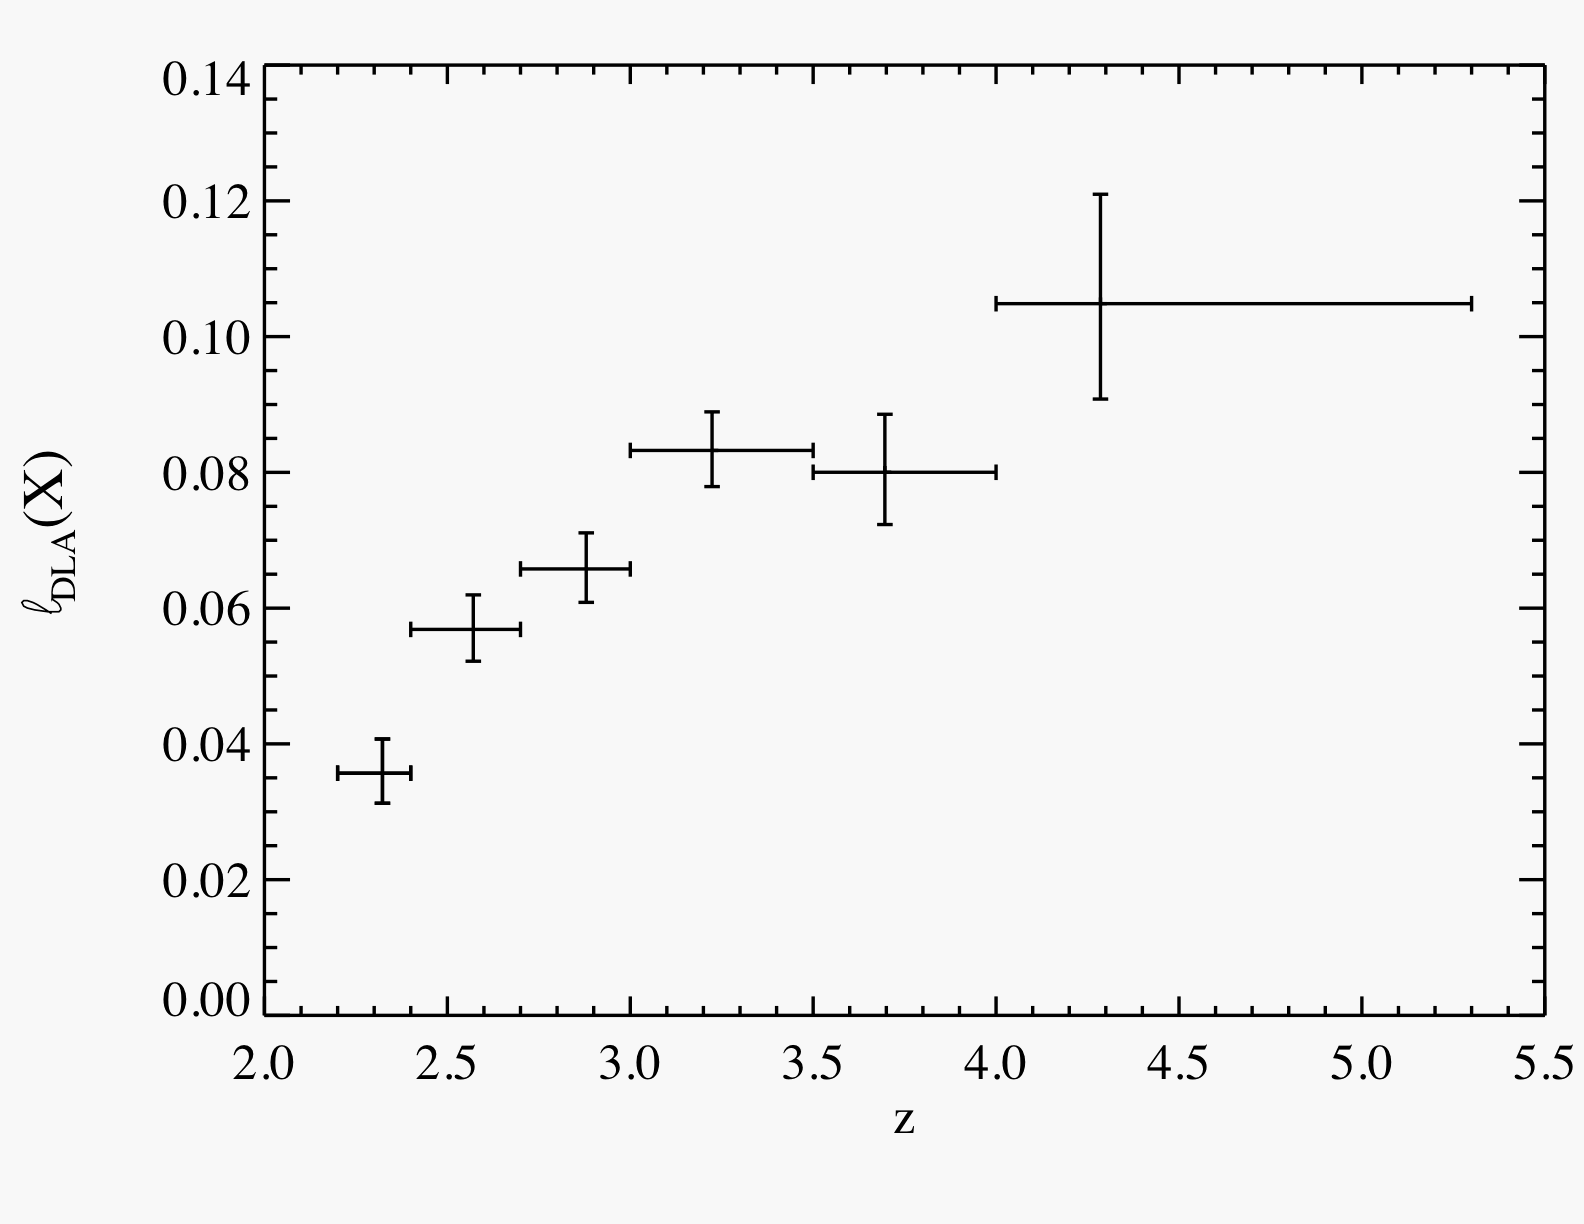
Line density of DLA systems from the SDSS shown as a function of redshift. HERE is a PDF of the figure.

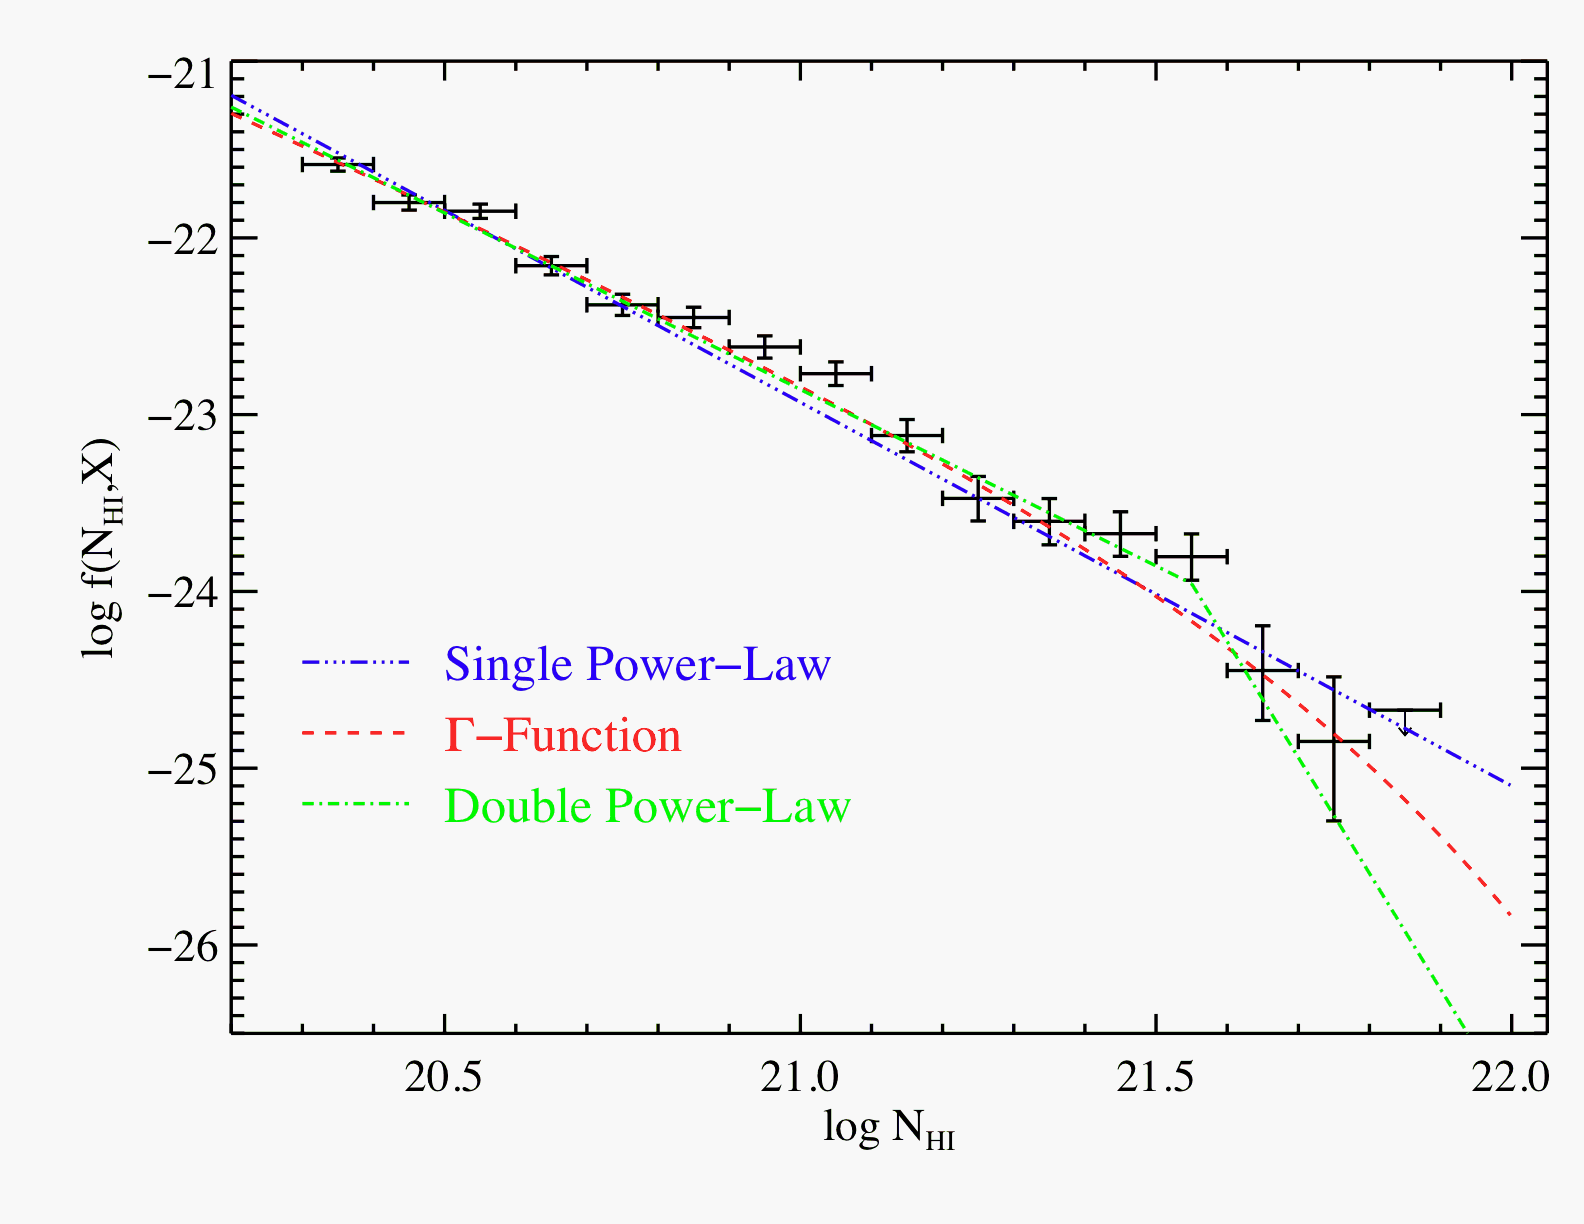
Frequency distribution of N_HI values for the DLA from the DR5. Overplotted on the data are three fits: a single power-law, a Gamma function, and a double power law. Note that the break in f(N) at log N_HI ~ 21.6 remains statistically significant. HERE is a PDF of the figure.

Omega_DLA as measured from the SDSS-DR5 DLA. HERE is a PDF of the figure.


This research is supported by the National Science Foundation (AST 03-07824 and AST 05-48180).
e-mail: xavier at ucolick.org
modified 09/10/07