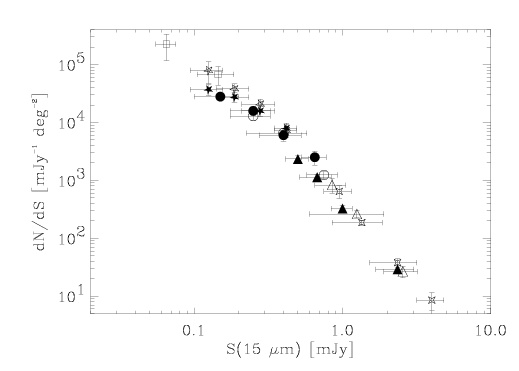
Figure 1: ISOCAM 15 microns differential counts
(Elbaz et al. 1999)
The ISOCAM 15 microns differential counts are shown in the Fig.1., where
the symbols correspond
to the following fields sorted by decreasing depth:
A2390 (empty squares), HDF-South (empty stars), HDF-North (filled stars),
Marano FIRBACK ultra-deep survey (UDS, filled circles), Marano ROSAT
(or proper) ultra-deep survey (empty circles), Marano FIRBACK deep survey
(filled triangles), Lockman Hole deep survey (empty triangles),
Lockman Hole shallow survey (empty stars, 4 branches).
Figure 1: ISOCAM 15 microns differential counts
(Elbaz et al. 1999)
In order to see the field-to-field variations in a given flux density range, we show a few zooms on the previous plot in the Fig.2
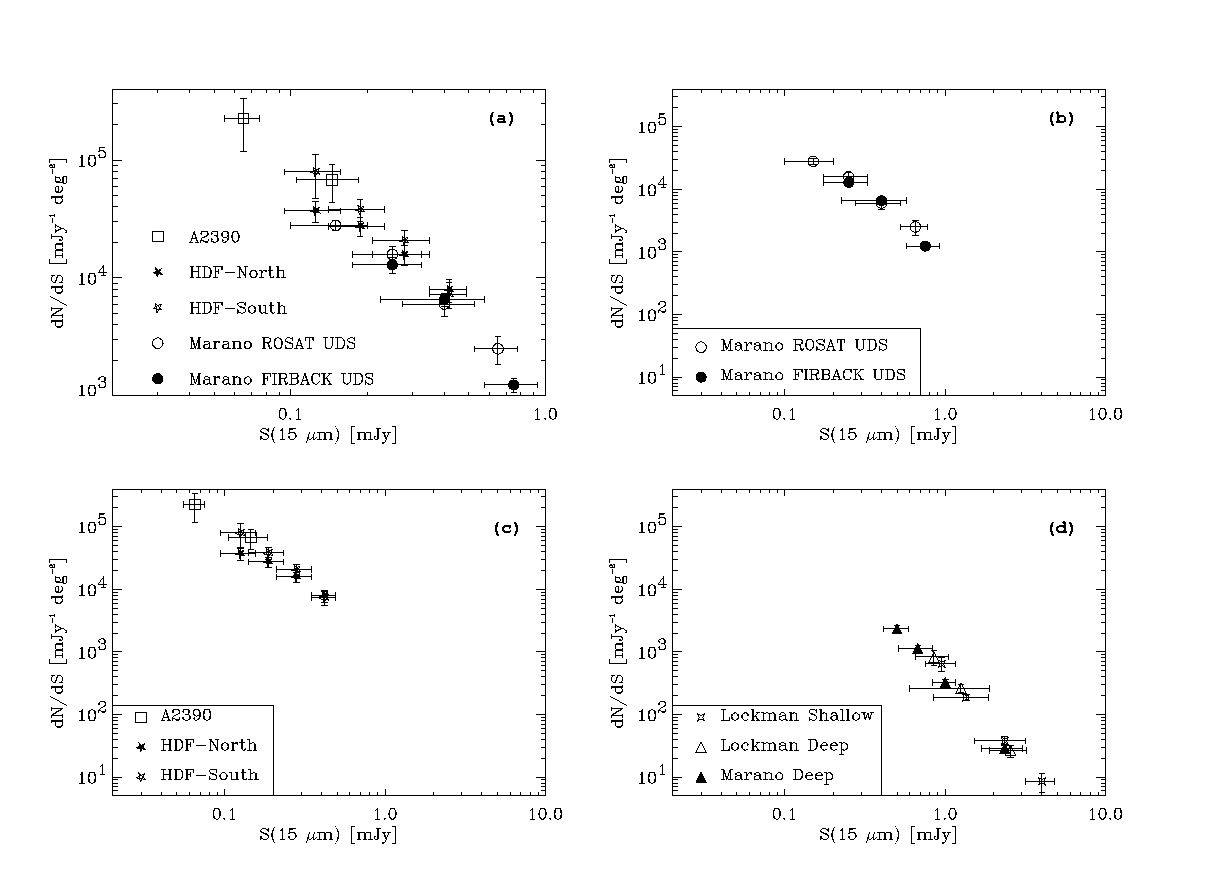
Figure 2: zooms on ISOCAM 15 microns differential
counts (Elbaz et al. 1999)
These figures confirm the compatibility of all surveys in a given flux
density range. In the Fig.2a, for exemple,
up to 5 different surveys cover the same flux density range and give
very similar number of sources per flux density bin.
If we only consider the Marano Proper (ROSAT field) and FIRBACK (field
1), in the Fig.2b, the similarity is striking.
Hence, the source density should not play a major role in the selection
of one or the other field.
The largest difference, of a factor 2 in dN/dS, is found around 0.1 mJy, between the HDF-North on one side, and the HDF-South and lensing cluster Abell 2390 on the other side. However, it is not possible yet to attribute this difference to cosmic variance since the HDF-North is slightly shallower than the two other fields and suffers from some incompleteness below 0.12 mJy. The correction for completeness around 0.1 mJy may have been underestimated in the HDF-North.
To conclude, we do not believe that the ISOCAM
15 microns counts involve a strong cosmic variance for the source
density of sources brighter than ~0.1 mJy
at 15 microns.