DEIMOS Alternate Preconstruction Optical Designs for
15.0-Inch f/1.29 and 14.0-Inch f/1.25 Camera Lenses
by
1.Introduction
An initial preconstruction optical design for an all-refracting 12.0-inch f/l.Ol spectrograph camera-08 for the DEIMOS (formerly DEEP) spectrograph was presented in a previous report (Epps, September 8, 1993). The baseline system, Run No. 7069 (08/23/93), imaged over a flat 4.84-inch diameter field within the (0.44 to 1.10)-micron chromatic range without refocus. It showed an rms image diameter of 29.3 +/- 6.1 microns averaged over all field angles and colors, with 27.9 microns of maximum rms lateral color. Its detailed imaging performance is shown here in Table 1 for which the camera was illuminated by a (7.0 by 9.33)-inch elliptical pupil located 11.5 inches ahead of the first lens vertex. This illumination pattern simulated a typical application in spectroscopic mode with a 1200 linelmm grating.
Some concerns regarding the 12.0-inch baseline design are as follows:
With these criticisms and limitations in mind it seemed prudent to investigate (slower) longer focal length cameras which would at the same time relieve some of the residual aberration problems as well as improve the sampling. At the same time it was decided to reduce the collimator focal length from 90.0 inches to 86.5 inches, thus reducing the beam diameter to some 6.33 inches (with the outer 7% of the radius underfilled by the Keck primary mirror).
Under these circumstances it can be shown that a 15.0-inch focal length camera will yield a sampling factor of 8.38 pixels/arcsec for imaging and a slit-size resolution product of 3494 for the aforementioned grating setup. A 0.58-arcsec slit is required to produce a spectral purity of 6000 and a 3.30 pixel/resolution-element spectral sampling factor is obtained. If the camera focal length were 14.0 inches instead, one would have 7.83 pixels/arcsec for imaging. The slit-size resolution product of 3494 and 0.58-arcsec slit for spectral purity of 6000 would remain the same while the spectral sampling factor would be reduced to 3.09 pixels/resolution-element.
2.Basic Lens Element Configuration and Glass Selection
The 12.0-inch baseline camera provided a starting point for this design study. Its focal length was increased to 15.0 inches and its field angle was reduced (slightly) to 11.4 degrees (radius) so as to produce a 6.0-inch diameter field of view. The entrance aperture was limited to 11.64 inches diameter so as to insure that a maximum blank diameter of 14.38 inches for the largest CaF2 element would provide enough extra material for mechanical mounting.
The @PSK2 meniscus shell was eliminated entirely, leaving the large CaF2 element as a singlet. The @KZFS4 and @BAlLF3 elements were reversed in the triplet so as to place the higher dispersion material on the trailing side where it could be thinned. The interface curvature in the following doublet was controlled so as to insure that the @LAK0l blank diameter would not exceed the 60.0-mm limit.
The elements near the focal surface were respaced for added mechanical clearance and the b.f.d.was reset and held near 0.200 inches.
3.Baseline 15.0-Inch Focal Length Model
With these changes in place the optimization proceeded very much as described in the previous report (Epps, September 8, 1993). A sequence of glass exchange calculations was executed in order to find a suitable replacement pair for the scarce (@BALF3/@KZFS4) elements. It was found that (~SSK5/~KZFS0l) were the best alternatives. These are both "A-type" glasses in the Ohara catalog, which means that they are melted on a high volume production basis. They also have suitable counterparts in the Schott catalog (&SSKN5/&KZFSN4) and in the Hoya catalog (BaCED5/ADFl0).
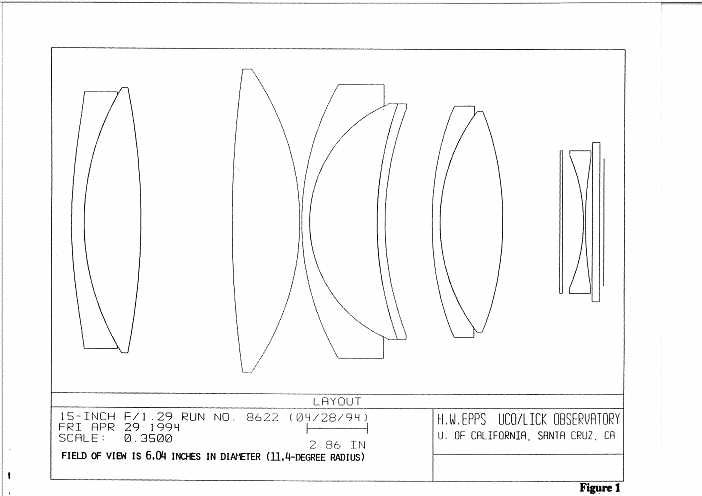
Run No. 8622 (04/28/94) is the best in a sequence of 15.0-inch focal length broad passband (0.44 to l.l0)-micron designs matching the aforementioned description. Its system prescription is given in Table 2 (2 pages). A layout of this camera-11 model is shown in Figure 1 which is drawn at 35.0 percent of full scale. When used in spectroscopic mode with a (7.0 by 9.33)-inch elliptical entrance pupil, this camera shows an rms image diameter 18.4 +/- 5.6 microns averaged over all field angles and colors without refocus, with 21.0 microns of maximum rms lateral color. Thus the image quality as well as the lateral color correction are greatly improved as compared with the baseline 12.0-inch focal length model, in spite of the longer focal length and larger field diameter in the present model.
The strong aspheric on the 0.59-inch convex sagitta of the 11.64-inch clear diameter of the leaching surface of the @LAK7 element has a MAD of some 0.0465 inches. This is comparable in size and maximum aspheric slope gradient to aspheric surfaces which have already been produced in the Lick Observatory Optical Laboratory. The two additional aspherics have lesser amplitudes on smaller surfaces which are nearer to the focal plane and are thus less affected by residual slope errors of manufacture.
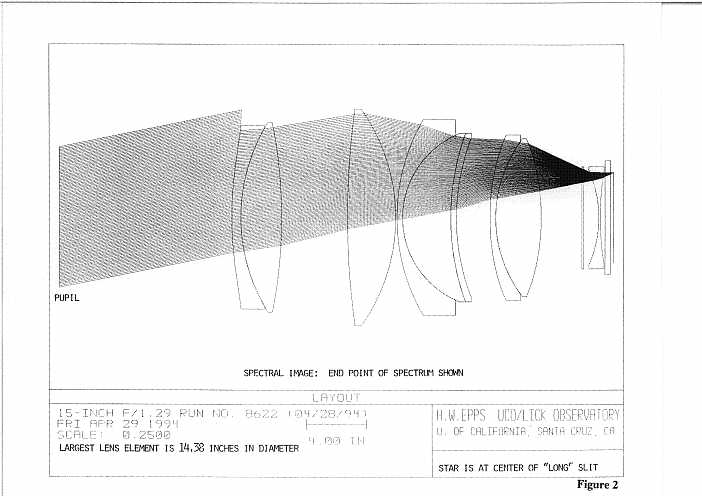
Figure 2 is a layout of Run No. 8622 (04/28/94) drawn at 25.0 percent of full scale. The entrance pupil is shown at the left, 11.5 inches ahead of the first lens surface. A parallel bundle at full field can be seen leaving the (7.0 by 9.33)-inch elliptical pupil used for the design and arriving in focus on the detector at the right The vignetting can be seen as rays which terminate abruptly at the first optical surface where the aperture stop has been placed.
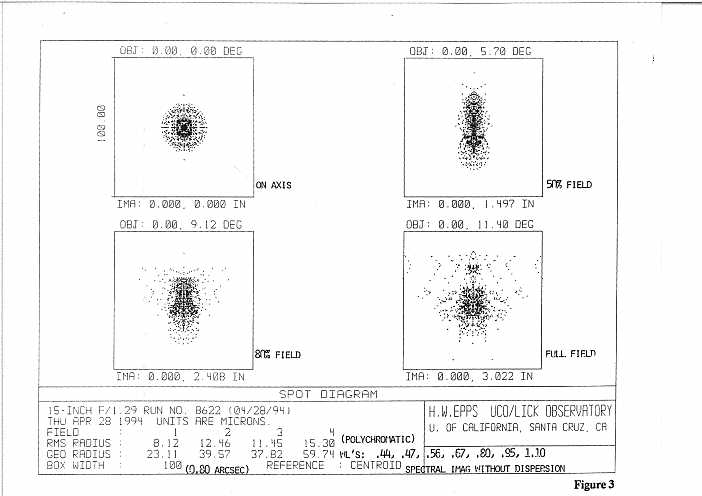
As a "sanity check" a polychromatic ray trace containing light at 7 wavelengths distributed throughout the (0.44 to 1.10)-micron broad passband was done at 4 field angles (on axis, 0.50, 0.80, full field). This is shown in Figure 3, wherein the I00-micron square superimposed on each image represents a (0.80 by 0.80)-arcsec box. This method of (theoretical) polychromatic imaging, which I call "spectral imaging without dispersion," is more severe than reality. In a real polychromatic (direct) image, the pupil would be a 6.33-inch diameter circle and thus the aberrations would be less than for the larger elliptical pupil used here. A real spectroscopic image which might have to accommodate the elliptical pupil would not suffer from the lateral chromatic aberration (lateral color) which is clearly evident as a major aberration in these images. In spite of the artificial severity of this procedure, the worst-case image at nominal focus shown an rms radius of only 15.3 microns (some 0.26 arcsec in diameter).
Detailed monochromatic spectral image analysis with the same (7.0 by 9.33)-inch elliptical pupil is given at 15 wavelengths in Table 3 which shows rms image diameters as a function of field angle. Full field corresponds to a 6.04-inch diameter at the detector! The 0.43-micron entry lies outside the design wavelength range but it is included here to show the image decay gradient at the blue end of the spectral passband. A lateral color analysis is also given in Table 3, where "zero" represents the centroid of the polychromatic combination of the 6 representative wavelengths shown. It can be seen that the imaging is very well balanced over the full passband and much improved compared with the baseline 12.0-inch camera whose performance is shown in Table 1 (over a smaller 4.84-inch diameter field).
4.Baseline 14.0-Inch Focal Length Model
Optimization of the 14.0-inch model proceeded very much as outlined above in Section 3 for the 15.0-inch model. The entrance aperture was limited to some 11.19 inches in order to accommodate the maximum 14.38-inch CaF2 boule diameter as previously described. Thus, the 14.0-inch camera suffers slightly more vignetting near the ends of the spectra for large anamorphic factors as compared with the 15.0-inch model.
The maximum field radius was increased to 12.2 degrees so as to produce the same 6.04-inch diameter field of view seen in the 15.0-inch model. The glass choices and configuration are the same as in the 15.0-inch model.
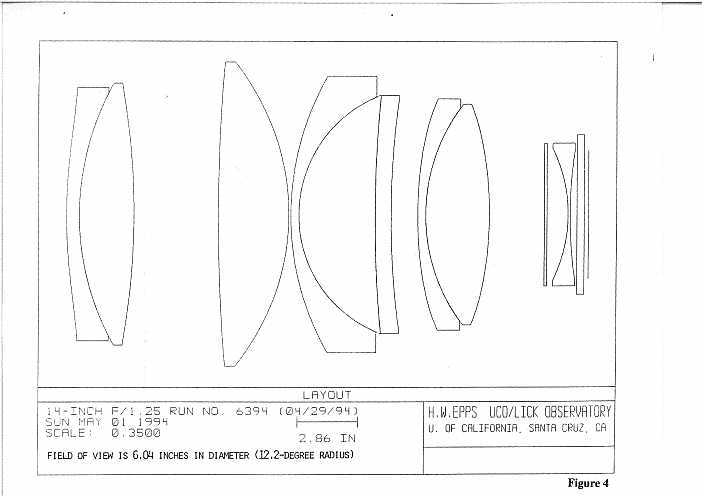
Run No. 6394 (04/29/94) is the best in a sequence of 14.0-inch focal length broad passband (0.44 to 1.10)-micron designs matching the aforementioned description. Its system prescription is given in Table 4 (2 pages). A layout of this camera-12 model is shown in Figure 4 which is drawn at 35.0 percent of full scale. When used in spectroscopic mode with a (7.0 by 9.33)-inch elliptical entrance pupil, this camera shows an rms image diameter of 21.9 +/-6.5 microns averaged over all field angles and colors without refocus, with 22.1 microns of maximum rms lateral color. Thus the image quality as well as the lateral color correction are slightly inferior to the 15.0-inch camera but still much better than in the baseline 12.0-inch camera.
The strong aspheric on the 0.48-inch convex sagitta of the 11.19-inch clear diameter of the leading surface of the @LAK7 element has a MAD of some 0.0500 inches. This is comparable in size and maximum aspheric slope gradient to that found in the 15.0- inch camera. The two additional aspherics have somewhat larger amplitudes than their counterparts in the 15.0-inch camera which will probably increase the fabrication time by perhaps 100 man hours per surface, relative to the 15.0-inch camera. This is not considered as a serious limitation or cost driving factor.
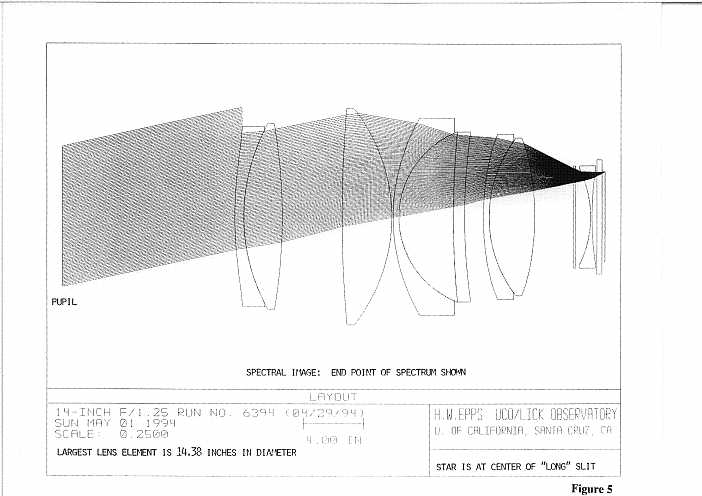
Figure 5 is a layout of Run No. 6394 (04/29/94) drawn at 25.0 percent of full scale. The entrance pupil is shown at the left, 11.5 inches ahead of the first lens surface. A parallel bundle at full field can be seen leaving the (7.0 by 9.33)-inch elliptical pupil used for the design and arriving in focus on the detector at the right The vignetting can be seen as rays which term in ate abruptly at the first optical surface where the aperture stop has been placed.
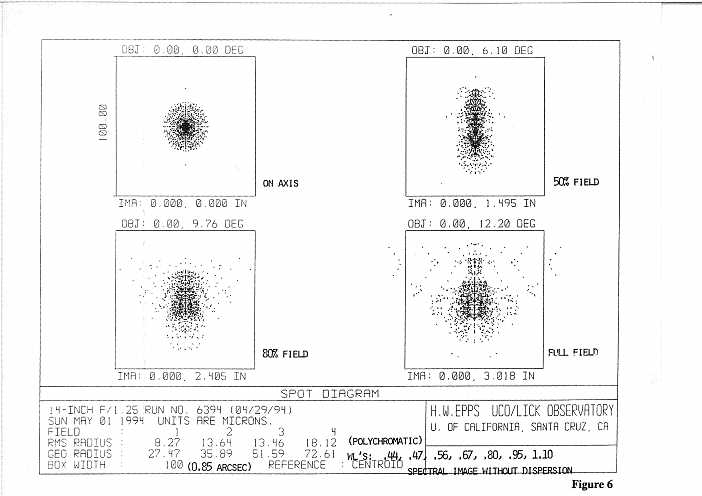
As a "sanity check" a polychromatic ("spectral imaging without dispersion") ray trace containing light at 7 wavelengths distributed throughout the (0.44 to 1.1 0)-micron broad passband was done at 4 field angles (on axis, 0.50, 0.80, full field). This is shown in Figure 6, wherein the 100-micron square superimposed on each image represents a (0.85 by 0.85)-arcsec box. The physical size of the field of view is the same as that shown in Figure 3 for the 15.0-inch camera and it can be seen that the images here are just a bit softer. The worst-case image at nominal focus shows an rms radius of 18.1 microns (0.31 arcsec in diameter).
Detailed monochromatic spectral image analysis with the same (7.0 by 9.33)-inch elliptical pupil is given at 15 wavelengths in Table 3 which shows rms image diameters as a function of field angle. Full field corresponds to a 6.04-inch diameter at the detector! The 0.43-micron entry lies outside the design wavelength range but it is included as before to show the image decay gradient at the blue end of the spectral passband. A lateral color analysis is also given in Table 3, where "zero" represents the centroid of the polychromatic combination of the 6 representative wavelengths shown. It can be seen that the imaging is very well balanced over the full passband and it is comparable in quality to that of the 15.0-inch camera except at the outermost parts of the field.
5.Availability of Optical Materials
It was anticipated in the previous report that the most difficult material to obtain would be the 3 large pieces of CaF2 which are only made in the 14.4-inch diameter (largest piece) by Optovac in North Brookfield, MA. The material is "grown" as a synthetic crystal in "boules" (sometimes called "ingots") which are cylindrical with a 3-inch height topped by a 2-inch tall cone shape. The growing and annealing period is approximately one month, followed by about 2 weeks for cleanup, inspection and analysis. There is no way to predict whether a given growth/inspection cycle will be successful and failures do occur.
A single 14.4-inch boule was ordered as a proof of procedure from Optovac at a cost of some $25,000.00 f.o.b. North Brooksfield, MA. That boule has been delivered successfully to the Lick Observatory Optical Laboratory and it looks absolutely excellent in optical quality. Having produced this boule, (at a fixed-price cost of some $270.00 per pound), Optovac has now agreed to provide subsequent boules on a price by volume basis at a cost of $200.00 per pound for the boule sizes we need. This is detailed in a letter from Optovac General Manager Mr. Rob Sparrow dated (04/28/94) to Harland Epps (see Figure 7). I have estimated that the delivered price for the three boules (of different sizes) needed for each camera will be about $52K, for either of the camera designs described herein.
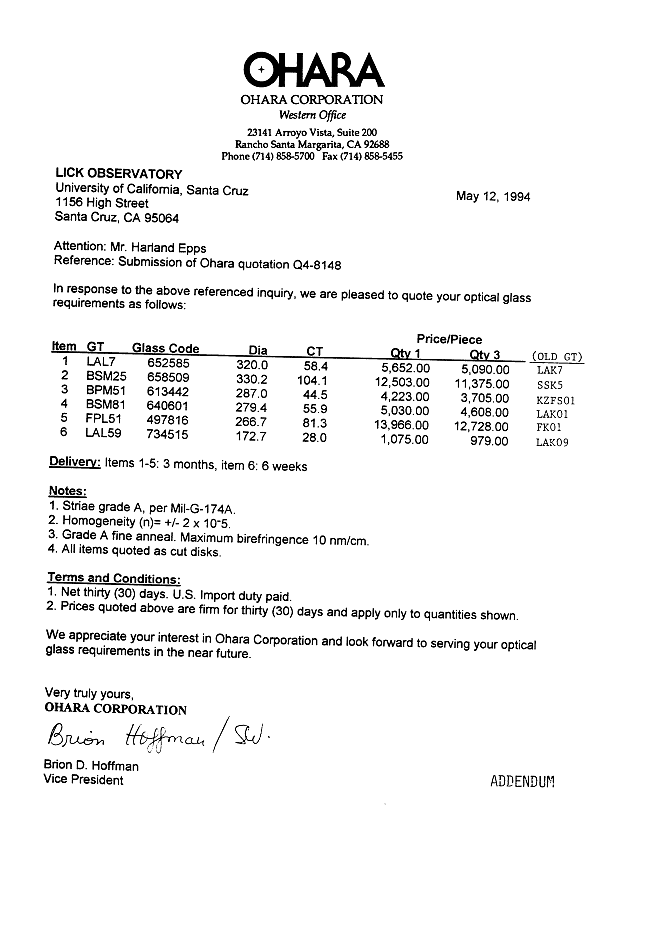
The optical glasses should not be a problem. Ohara has indicated an intention to bid on the required pieces of @LAK7, @LAK0l; @FK0l and @LAK09. They are presently considering the availability of the @SSK5 and @KZFS0l materials which are both high production volume glasses. These should also be available from Schott and/or Hoya.
As a matter of passing interest, the approximate weights (in pounds!) of the finished lens elements in the 15.0-inch camera-11 and in the 14.0-inch camera-12 were calculated. These are summarized in Table 5.
6.Conclusions
As the result of this study, it appears that viable 15.0-inch and 14.0-inch focal length preconstruction optical design alternatives for the DEIMOS spectrograph cameras are superior to the baseline 12.0-inch camera in several ways:
A. Descriptions
Figure 1. Layout Drawing of 15.0-Inch Focal Length Camera-11 Run No. 8622 (04/28/94)
Figure 2. Layout Drawing of Camera-11 for Spectral Imaging (Entrance Pupil Shown)
Figure 3. Polychromatic "Spectral Images Without Dispersion" for Camera-11
Figure 4. Layout Drawing of 14.0-Inch Focal Length Camera-12 Run No. 6394 (04/29/94)
Figure 5. Layout Drawing of Camera-12 for Spectral Imaging (Entrance Pupil Shown)
Figure 6. Polychromatic "Spectral Images Without Dispersion" for Camera-12
Figure 7. Price Quotation for Large Calcium Fluoride Ingots
Addendum. Price Quotation for Optical Glass from Ohara Corporation May 12, 1994
1. Epps' Sign Convention and Nomenclature
In the system prescription tables which follow throughout this report, the following sign convention and nomenclature are used:
System prescriptions are given in terms of "curvatures" (CRV) and "thicknesses" (X). For curvature, read "reciprocal radius of curvature." For thickness, read "vertex distance following surface #_." All length-related dimensions are given in inches unless otherwise noted. Surface #1 is the entrance pupil (marked PU) which is flat and has no curvature line. Each optical surface (starting with surface #2) has a curvature line followed by a thickness line. The distance following the last optical surface (which precedes the focal surface) is the distance to the Gaussian focal plane. The distance "following" the focal surface (marked XP) is the "refocus" distance to be added algebraically to the thickness of the last optical surface in order to arrive at the (compromise) "best focus" location for the primary passband. Similarly (XS) is the refocus distance for the secondary passband (if any).
The standard "sag" equation which defines the precise shape of each surface is shown below:
                Cy^2
"sag" = ----------------------  + A4y^4 + A6y^6 + A8y^8 + A10y^10
	1+[1-C^2y^2(1+A2)]^1/2
where C is the curvature and y is the radial coordinate. If all A_ values higher than A2 are zero, the "sag" equation represents a general conic with A2 = -e^2 By convention, light enters from the left, moving toward the right. Distances measured toward the right are (+); toward the left are (-). Any curvature is (+) if its center of curvature is to the right of the surface vertex; a curvature is (-) if its center of curvature is to the left of the surface vertex. The sign of the index of refraction changes sign upon reflection. Any distance is real if the algebraic product of itself multiplied by the index of refraction through which it is measured is a (+) value; a distance is virtual if said algebraic product is a (-) value.
A typical surface # (NS) is represented in the system prescription by two horizontal lines of floating-point numbers. The first number in the first (typical) line for a given surface # is the curvature, followed by five (5) values which are aspheric coefficients (A2, A4 A6, A8, A10), except for the final (focal) surface which may have a conic A2, but not (A4 . . . A10) which take on different meaning. The first number in the second (typical) line is the thickness, followed by index data which are specific to OARSA and can be ignored.
(CLA DIA) is the diameter of the optical surface required in order to prevent vignetting. (SAG) is the sagitta of the surface of that diameter. (MAD) is the maximum aspheric deviation of the surface of that diameter. In practice (CLR DIA) may be up to 1.5% larger than actually required but it is never smaller than required.
The prefix symbol (@) is used for Ohara optical glass. The suffix (Y) signifies material with enhanced ultraviolet transmission relative to the "normal" melts of the same Ohara glass type. The prefix symbol (&) is used for Schott optical glass while the prefix (%) is used for "other supplier" optical glass. Catalog refractive indices at T = 20 C are used unless otherwise designated in the body of the Report.
2.Optical Image Quality Criteria
Image quality is most properly and completely described in terms of modulation transfer functions which are, unfortunately, somewhat laborious to calculate and display. They in turn are determined from so-called point spread functions which themselves can be derived by ray tracing in the geometric limit where diffraction is unimportant as a source of aberration. Often it is convenient to average over the energy distribution within an image and simply quote an rms image diameter (in microns or arcsec) with respect to the image centroid. It is useful to note that if an image energy distribution were radially symmetric and Gaussian in profile, there would be 50% of the energy within the full-diameter-at-half-maximum (0.83 rms diameter); 63.2% energy within 1.00 rms diameter; 80% energy within 1.27 rms diameter; and 90% energy within 1.52 rms diameter. The energy distribution within a real image may differ from these guidelines to the extent that the image is asymmetric and/or non-Gaussian but the concept of rms image diameter remains useful nonetheless for the purpose of quantitative discussion and intercomparison of related design-alternative systems.
My optical design code, OARSA, uses a pattern of 188 rays distributed uniformly over the clear entrance aperture to determine the rms image diameters within two independent passbands. Each passband is defined by a redmost and bluemost wavelength and a "central wavelength" representing the optical center of gravity of that passband (i.e., an average, weighted by the dispersion curve of a "typical" optical glass). Thus, six (6) wavelengths are evaluated. Refocus between passbands may or may not have occurred (see bottom of system prescription). Refocus never occurs within a passband.
This image evaluation is repeated at each of four (4) field angles which typically include: on-axis, 50%, 80%, and 100% of full field. Thus, for each system model, a group of twenty-four (24) separate images is evaluated during the design process and a "typical" rms image diameter averaged over all field angles and wavelengths is reported with the output system prescription, together with an estimate of its standard deviation. Average rms path length error is also reported.
A potentially systematic polychromatic image error that does not add quadratically to rms image diameters is lateral chromatic aberration (lateral color) which results from the (possible) dependence of system magnification on wavelength in refracting optics. Lateral color causes a polychromatic image to spread into a spectrum. It usually increases directly with field angle but can exhibit more complicated dependence in sophisticated lenses. OARSA estimates rms lateral color at each off-axis field angle by calculating the variance of image centroids with wavelength. It then reports the square root of the maximum value as the maximum rms lateral color, with the output system prescription. In the body of the text (typical) rms image diameters and (maximum) rms lateral color as defined above may be quoted as a means of intercomparison between design alternatives.