|
Procedure: Seeing, Freid (r0) parameter and Transmission
Estimates
The following data acquisition and analysis procedures are expected to be
routinely conducted when commencing on-sky activities (typically during
evening twilight) in an effort to characterize prevailing conditions
(e.g. seeing; Freid parameter, r0; Transmission).
Data Acquisition (seeing-logging; data())...
-
V=6.5-7.5: Acquire V=6.5-7.5 magnitudeNote 1,
isolated star near zenith.
Must not saturate ShARCS or guide camera.
Typically, useful isolated sources have HD or BD identifiers.
SIMBAD basic query
-
Guide camera: Focus star; Estimate prevailing seeing.
-
Isolated, point source verfication (ShaneAO - tt peeko GUI).
-
COG:
Set center-of-gravity (COG) centroiding.
(WFS centroider: GOG; Refcents file: corresponding to COG).
Alternatively: cent('cog')
-
WFS camera dark; TT camera dark: Acquire backgrounds
(Offset telescope, WFS camera dark, TT camera dark, Back to target).
-
Close WFS loop (ShaneAO loop control GUI).
Verify functionality/stability/offloading.
-
-0.5 < foc < + 3.0 (ShaneAO - peeko GUI).
-
Open loops (in ShaneAO loop control GUI).
-
Update boresight indicator, if necessary.
-
seeing-loggingNote 2:
Execute the following command, responding to prompts where appropriate:
user@shimmy.ucolick.org:/u/user/observers/lgs/saocon_setups/seeing-logging.sh
-
Telemetry data: Acquire at least one (Open loops) data set:
-
Actions... Save telemetry data
(ShaneAO loop control GUI).
Alternatively: data()
-
File produced should be of the form:
/data/telemetry/YYYY-MM-DD/Data_XXXX.fits
(e.g: /data/telemetry/20XX-XX-XX/Data_0003.fits)
Telemetry Analysis (ta)...
Function: Analyze and plot Adaptive Optics telemetry data.
Estimate Freid parameter, r0 and transmission, T from telemetry data.
Prerequisites: At least one (open loop) telemetry data file.
Execution:
-
Connect to appropriate host machine:
ssh -l user -X karnak.ucolick.org
-
Activate Python environment:
conda activate shaneao
-
Execute telemetry analysis (ta) command, e.g:
ta -n 2,3 -p -s 'HD 172243' -d 2021-09-22
where,
-n 2,3 specifies the identity(ies) of the (open loop) telemetry
file(s) to be analysed.
-p specifies that a plot should be displayed.
-s 'HD XXXXXX' (explicit single quotation marks) specifies the
source corresponding to the data (as identified in SIMBAD database).
This information is used for calculating transmisson estimates, T.
-d YYYY-MM-DD specifies the acquisition date of the files to
be analysed.
-
To exit, select close from plot window frame pull-down menu.
Characteristics:
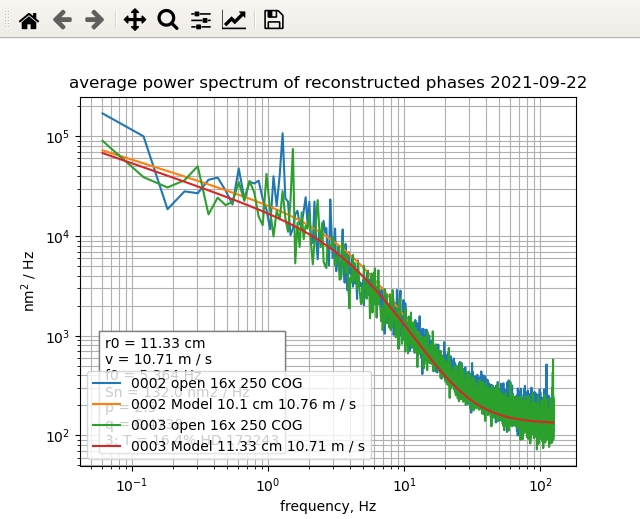 Example Output:
   Data_0002 16x 250.0 Hz COG open
   r0 = 10.1 cm
   v = 10.76 m / s
   f0 = 5.192 Hz
   Sn = 157.5 nm2 / Hz
   p = 2.5
   q = 0.4327
   star = HD 172243
   T = 15.9 %

   Data_0003 16x 250.0 Hz COG open
   r0 = 11.33 cm
   v = 10.71 m / s
   f0 = 5.364 Hz
   Sn = 132.0 nm2 / Hz
   p = 2.5
   q = 0.4738
   star = HD 172243
   T = 16.4 %
-
Preliminary (2021-09-XX) Freid paramater thresholds:
NGS > 6 cm;
LGS > 9 cm.
-
Preliminary (2021-09-XX) transmission values:
10 - 12 %.
-
Expect small peak at circa 200 Hz (due operating frequency of mirror).
-
For more information, execute following command: ta -h
Seeing Analysis (sa -p)...
Function:
Read and analyze Tip-Tilt data files to evaluate seeing (excluding
semi-static component).
Determine FWHM and Freid parameter, r0 (at 550nm).
Prerequisites: At least one (open loop) telemetry data file.
Execution:
-
Connect to appropriate host machine:
ssh -l user -X karnak.ucolick.org
-
Activate Python environment:
conda activate shaneao
-
Execute seeing analysis (sa) command, e.g.:
sa -p -d 2021-09-22
where,
-p specifies that a plot should be displayed.
-d YYYY-MM-DD specifies the acquisition date of the files to
be analysed.
-
To exit, select close from plot window frame pull-down menu.
Characteristics:
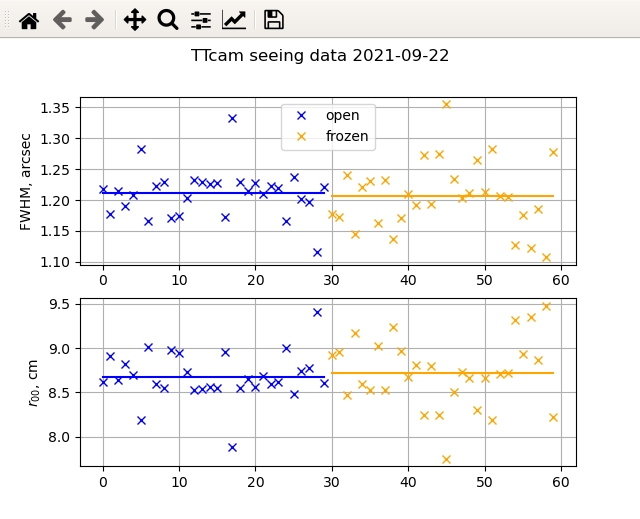 Example Output:
   -------- Seeing 2021-09-22 --------
   average FWHM: 1.21 arcsec
   average r0: 8.72 cm
   ---------------------------------
-
Excludes semi-static components (therefore a more faithful
representation of Freid parameter, r0.)
-
Reports average values.
-
For more information, execute following command: sa -h
Record Paramaters...
Shane Adaptive Optics Parameters
DIMM (Deprecated 2021-09-XX)...
Function: Hartmann Sensor Differential Image Motion Monitor (DIMM) analysis.
Prerequisites: At least one (open loop) telemetry data file.
Execution:
Characteristics:
   gavel@real > dimm -h

   dimm [-h --help | -d date ] filenum

   Use DIMM analysis to produce a histogram of possible seeing FWHM
   given an open-loop data telemetry file (result from a ShaneAO 'data()' command)

   Arguments:
   -h, --help: print help
   -d date: set the date of the desired file directory using the format
   YYYY-MM-DD. Default is today's date
   filenum: an integer. Data files are named Data_xxxx.fits where xxxx is
   the file number. You don't need the leading 0s.

   Examples:
   dimm 2                <- evaluate file Data_0002.fits in the present night's directory
   dimm 0002             <- leading zeros are ok
   dimm -d 2015-06-29 2  <- evaluate file Data_0002.fits in June 29, 2015 directory
   dimm -d 6-29 2        <- present year is implied
   dimm -d 29 2          <- present year and month is implied
   dimm /local/data/telemetry/2015-06-30/Data_0002.fits <- evaluate a specific file

   Outputs:
   "l" (longitudinal) and "t" (transverse) are two different ways of measuring the
   Hartmann dot differential image motion. On-sky, we find they usually give slightly
   different answers for seeing estimate.
Recording:
Record the following information corresponding to seeing measurements:
-
Date
-
Prevailing seeing estimate
-
Frame identifiers of guider images
-
ShaneAO telemetry data files.
-
Frame identifiers, Exposure times and Filter of ShARCS images.
Example
   2015 Jan 29:
   seeing ~1.5”
   Guider: seeing_2015-01-29_ 100 to 114
   2015-01-29/Data_0000.fits
   TT_Data 0 to 29
   sharcs #232 3s BrG
   TT_Data 30 to 59
   sharcs #233 3s BrG
Notes...
-
Note 1:
-
Originally, the recommended magnitude was circa V=8.5.
However, 2016 discussions with D. Gavel yielded recommendation for
brighter stars.
-
Note 2:
-
The seeing-logging script has pauses to accommodate
configuration and progress checks. Respond to prompts where appropriate.
The script writes a log file and copies the appropriate files to a
single directory.
The data are copied to:
shimmy:/data/lgs_tmp/
and into a date-stamped sub-directory, of the form:
20XX-XX-XX.
|