Table 7 lists the limiting magnitudes for imaging a constant surface brightness patch (such as a gas cloud). These limits were calculated by assuming a patch of area 1 arcsec imaged on the detector. Then flux from the source and sky reaching the detector and the read noise in the patch were calculated.
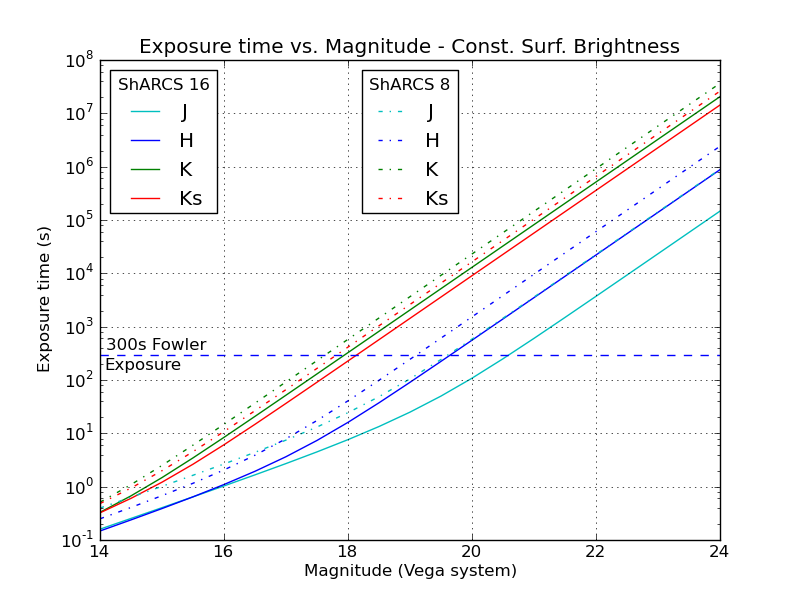
Figure 6:
Constant surface brightness patches - Exposure time required to reach SNR=5 vs. magnitude (Vega system) in different filters for ShARCS 8 (ShARCS + old laser) and full ShaneAO (ShARCS 16).
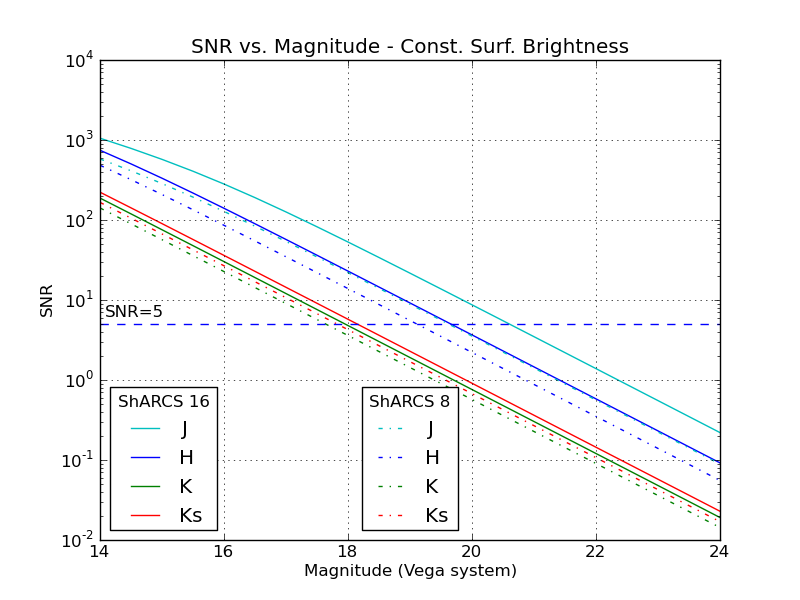
Figure 7:
Constant surface brightness patches - SNR vs. magnitude for one 300s fowler exposure in different filters for ShARCS (8 or 16 subapertures).