Spectra, PSF and Instrumental Profiles


next up previous contents
Next: Fitting Algorithm Up: Fitting Model Previous: Velocity Field

Spectra, PSF and Instrumental Profiles

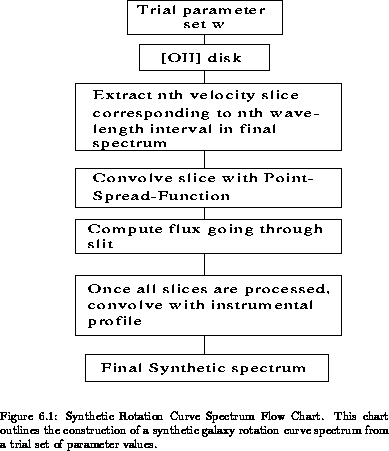
  Slit spectra are said to be two-dimensional (2D). The abscissa of slit spectra (also called the spatial axis) is the position along the slit. The ordinate is wavelength, and the wavelength interval per pixel is called the dispersion. The intensity as a function of position along the spatial axis is the flux integrated over the slit width at each position. All spatial information perpendicular to the spatial axis is thus lost. The simulated spectra were built wavelength interval by wavelength interval. The k pixel along the dispersion axis is bounded by two wavelengths, and , corresponding to two velocities, V and V. This velocity window was used to build a narrow-band image of the simulated disks from [OII] fluxes at locations with projected velocities between V and V.

The k narrow-band image was then convolved with the point-spread-function (PSF) of the telescope. The PSF is the image of an unresolved source produced by the telescope. Although it has been traditionally approximated by a Gaussian function, it is common practice to determine this function empirically from direct images to take into account instrumental aberrations. This was especially important for MOS observations as the MOS PSF varied considerably over the field of view. Bright stars as near as possible to slitlet position on direct images taken before and after spectroscopy on each object were used as PSF's. The volume under each PSF was normalized to unity to preserve the flux in each narrow-band image. The seeing convolved image was produced by Fourier transforming the product of the Fourier transforms of the PSF and initial images. After PSF convolution, the result of placing a slit in front of the convolved image was calculated by integrating the flux across the width of the slit at each position along the spatial axis. The resulting intensity profile was then placed in the k row of the simulated spectrum image. A 2D spectrum image of the simulated disk with infinite spectral resolution is obtained after repeating the above steps for each wavelength interval.

To take into account the finite spectral resolution, instrumental profiles were calculated from bright emission lines in comparison arc images. For a given galaxy, the arc emission line was chosen to be as close in wavelength as possible to the observed [OII] wavelength. The central columns of the arc line were summed together to produce a 1D instrumental profile. Each column of the 2D spectrum image was then convolved with that instrumental profile to produce the final synthetic spectrum image. Figure gif summarizes the steps in the construction of synthetic galaxy rotation curves from a trial set of parameter values.


next up previous contents
Next: Fitting Algorithm Up: Fitting Model Previous: Velocity Field


Luc Simard
Mon Sep 2 12:37:40 PDT 1996