The suspicious coin experiment is a particularly illustrative of the Bayesian approach adopted here. Consider a suspicious coin which has been tampered with so that the probabilities of getting heads or tails are not equal to 0.5 anymore. Let p be the true probability of getting heads, and let it be equal to 0.5 without, of course, telling the experimenter. For N tosses, the posterior probability distribution is given by
where n is the numbers of heads obtained after N tosses. In the extreme case of N = 1, there are obviously two possible outcomes: n = 0 and n = 1. Given only one of these outcomes, the (N = 1, n = 1) case say, the experimenter might be tempted to conclude that p = 1.0. However, according to equation ![]() ,
,  is equal to p, and its median value is 1/
 . This median value is already closer to p than the experimenter's first instinctive guess of 1.0. The information in is still very limited, but it is the best one can do with the current data.
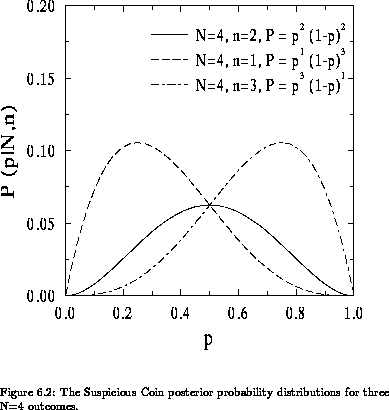
In order to improve his estimate of p, the experimenter must increase the signal-to-ratio of his data by increasing the number of tosses. Consider the N = 4 case of which three possible outcomes (n = 1, n = 2, n = 3) are shown in Figure ![]() . Only one outcome (i.e. one galaxy spectrum!) is accessible to the experimenter.
. Only one outcome (i.e. one galaxy spectrum!) is accessible to the experimenter.  and
and  are wide and asymmetric with maximum at p = 0.25 and p = 0.75 respectively. The location of the maxima is not surprising. The posterior probability distributions are simply saying that a ``good bet'' for the true value of p is n/N although it does not offer any guarantee that it is the best one. In both cases, the median values are closer to p than the ``good bet'' values are. The median values are less biased by noise than the ``good bet'' values. It is important to emphasize that these ``good bet'' values are picked by algorithms (such as least-squares fitting) trying to find the parameter value which minimizes
  without taking the topology of parameter space into account. Therefore, at low signal-to-noise ratios, the Bayesian parameter estimates will differ from least-squares estimates. Moreover, many least-squares routines give Gaussian errors based on a curvature matrix computed around the minimum. These Gaussian errors cannot accurately represent asymmetric posterior probability distributions.
Since  is symmetric about p = 0.5, is positively skewed (towards p), and is negatively skewed (also towards p), it might seem possible at first glance to cheat and tell in which direction p lies with respect to the median value of the posterior probability distribution. This is not so. remains the same whether p = 0.5 or 0.25. The (N = 4, n = 1) case is consistent with both values of p. Larger N's are needed to distinguish between p = 0.5 and p = 0.25.
As N becomes really large (high signal-to-noise ratios), n will be very close to pN. All posterior probability distributions will be symmetric and narrow. The suspicious coin experiment illustrates two important points. First, posterior probability distributions are not symmetric at low S/N. As a matter of fact, many real parameter posterior probability distributions in section ![]() are not symmetric. The errors quoted on parameter value estimates cannot be considered to be Gaussian. Second, least-squares fitting is the high S/N special case of the current approach, and least-squares is not as robust at low S/N.
are not symmetric. The errors quoted on parameter value estimates cannot be considered to be Gaussian. Second, least-squares fitting is the high S/N special case of the current approach, and least-squares is not as robust at low S/N.