 3600sec, N
 = 8 e
= 8 e ) of a z = 0.35 galaxy with V
 sin
sin  = 130 km/s, disk scale length of 2.0h
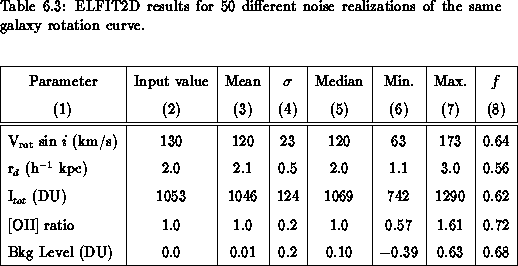
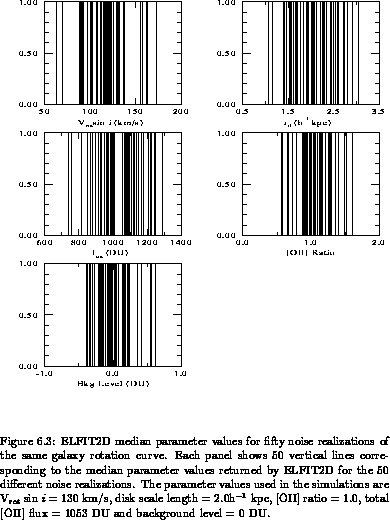
 kpc, [OII] ratio of 1.0, total [OII] flux of 1053 DU and background level of 0 DU was created. Random noise was added to this galaxy spectrum using the IRAF task MKNOISE in the ARTDATA package. Fifty galaxy spectra were created using a different seed for the noise each time. ELFIT2D was run with the same initial conditions on all fifty spectra. The results are given in Table
  of spectra in which the true parameter value was within the 68
 confidence interval derived by ELFIT2D from the posterior probability distribution
  . These confidence intervals include the true value between 0.56 and 0.72 of the time according to the
  = 5.8 Poisson error can account for the fluctuations seen in
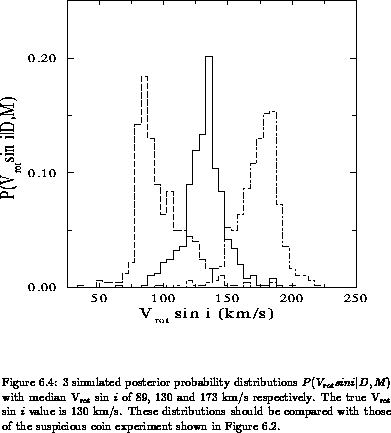
  for three noise realizations. It is interesting to note that the skewness of the distributions exhibits the same behavior as
  in the suspicious coin experiment (see Figure

