LRIS-ADC Homepage
Phillips' Figures for LRIS ADC
New materials:
DRAFT Delta-CoDR Optics Talk (PPT)
Differential distortion study (10feb03) and figures for text.
Model B Performance Supplement (31jan03)
Improved Throughput Estimates requested by Review Committee (20jan03)
Performance Results requested by Review Committee (21jan03)
Improved Throughput Estimates requested by Review Committee (20jan03)
Ghosting Discussion requested by Review Committee (15jan03)
Report discussing focal-plane tilt (08jan03; PDF) and ghosting (17jan03)
Figure showing the above problem schematically (06jan03)
Spot diagrams for various wavelengths (0.32--1.1 micron), all at
7 arcmin, and with
phi = 0,
phi = 90,
phi = 180.
These demonstrate the PSF does not change strongly with wavelength, even in the
UV. This is as expected, since the aberrations will be dominated by
the difference in index between fused silica (on average) and air, rather than
by the relatively small change in index as a function of wavelength.
(18jan03)
Old material:
Optics Talk (10:00 am)
Software Talk (11:20 am)
Atmospheric Dispersion vs Z
Atmospheric Dispersion vs Airmass
ADC-corrected Dispersion vs Z
Alternative (rejected) ADC Designs
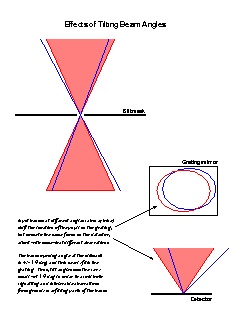
Effects of Tilted Input Beams
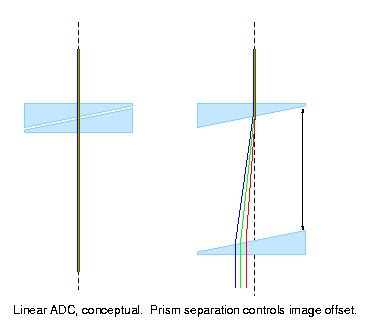
Linear ADC, Conceptual
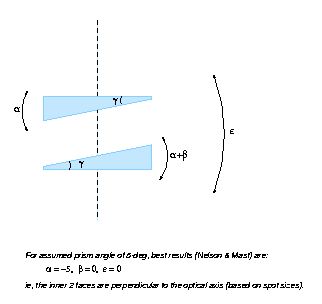
Linear ADC, Parameters to Vary
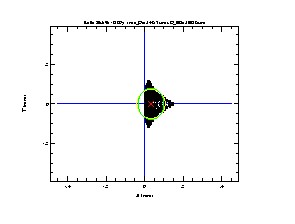
Spot Diagrams
Distortion with ADC
Click on pictures for PS versions.
|
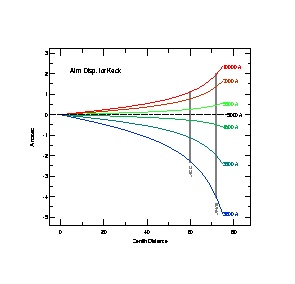
Atmospheric Dispersion (arcsec) at Keck, relative to reference position
of 5000 A light. Note how badly the dispersion increases after about 60-deg
zenith distance, nearly doubling at Z = 72-deg.
The refraction values in this figure were calculated using the Starlink
library refraction routines, with parameters for Mauna Kea.
|
|
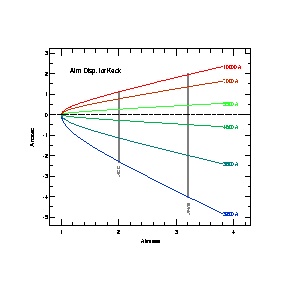
Atmospheric Dispersion (arcsec) at Keck, relative to reference position
of 5000 A light. Now plotted vs. airmass. Past Z = 60, the airmass changes
very rapidly with increasing zenith distance, so that the airmass is more
than doubled by Z = 72-deg.
|
|
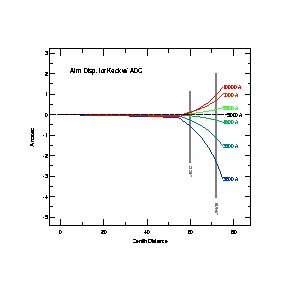
Atmospheric Dispersion (arcsec) with the ADC correction. The current
ADC design has only 700mm of travel, corresponding to full correction up to
Z = 55-deg. (The correction was calcuated using the Phillips-developed
IRAF software for producing ADC spot diagrams.)
|
|
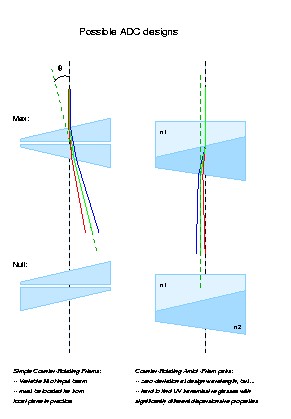
Different ADC design, rejected due to difficulties. On the left
is the crossed prism pair (Risley prism), which produces large and variable
tilt to the input beam. An Amici prism is a pair of prisms of different
glasses (eg crown and flint), combined to give zero-deviation at some
design wavelength but still disperse light. A pair of Amici prisms
can be crossed as with the Risley prism set (right) to produce zero-deviation of
the input beam. However, it is difficult or impossible to find
glasses with both the needed dispersive properties and high
tranmission over the range 0.3 to 1.1 micron.
|
|
Schematic showing conceptually the effects of a tilted beam entering
a slit (or arbitrary point in the telescope focal plane). The effects are
twofold: (1) the pupil is displaced on the grating; and (2) the beam now
runs through the instrument at non-design angles, leading to greater
aberrations. Thus, any angular deviation of incoming beams must be
small with respect to the beam opening angle.
|
|
Conceptual diagram of Linear ADC design. The second prism exactly
cancels the effects of the first prism, leaving only an offset in the
positions of the rays (and thus the images in each color). Note that
while this design is zero-deviation in angle, there is a large offset in the
position of the reference ray (green).
|
|
Diagram showing the free parameters for exploring improvements in
image quality. In the Nelson and Mast study (general Keck ADC), the
prism angle of 5-degrees was assumed, and values of alpha, beta and epsilon
coarsely tested. Best results were found with the inner surfaces
parallel and perpendicular to the optical axis.
|
|
Spot diagram for current ADC design, full 700mm extension, at 7 arcmin
off-axis. For scale, the box is 1-arcsec in Y. This figure is for PA of the
prisms at 0-degree wrt the field.
Other diagrams are available:
No ADC
ADC, zero-separation (null position)
ADC, 350 mm separation, PA=0
ADC, 700 mm separation, PA=0
ADC, 700 mm separation, PA=90
ADC, 700 mm separation, PA=180
|
|
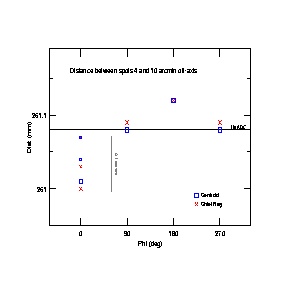
Plate-scale changes introduced by the ADC. As a quick test, the
distance between chief rays and centroids for spots located at 4 arcmin
and 10 arcmin off-axis were calculated using spot diagrams (above). As
seen in this figure, the maximum deviation from "No ADC" is about +/- 0.1
arcsec over 360 arcmin. NB: This does not include any
differential-refraction effects from the atmosphere!
|
Last modified: 27 nov 02
Andrew C. Phillips / Lick Observatory
phillips@ucolick.org