Opacity Data
Data from Freedman, Lustig-Yaeger, Fortney, Lupu, Marley, and Lodders (2014), ApJS, here. These calculations are of the Rosseland and Planck mean opacity from 75 K to 4000 K, and 1 microbar to 300 bar, on a nearly square grid. We include "standard" tables of calculations using the local weighting temperature. We also include mean opacities weighted by stellar effective temperatures (3000-7000 K), which are of some use in understanding the atmospheric mean opacity to incoming incident stellar flux.
Table 3, [M/H]=0.0, 1X solar
Table 4, [M/H]=0.5, ~3X solar
Table 5, [M/H]=0.7, ~5X solar
Table 6, [M/H]=1.0, 10X solar
Table 7, [M/H]=1.5, ~30X solar
Table 8, [M/H]=1.7, ~50X solar
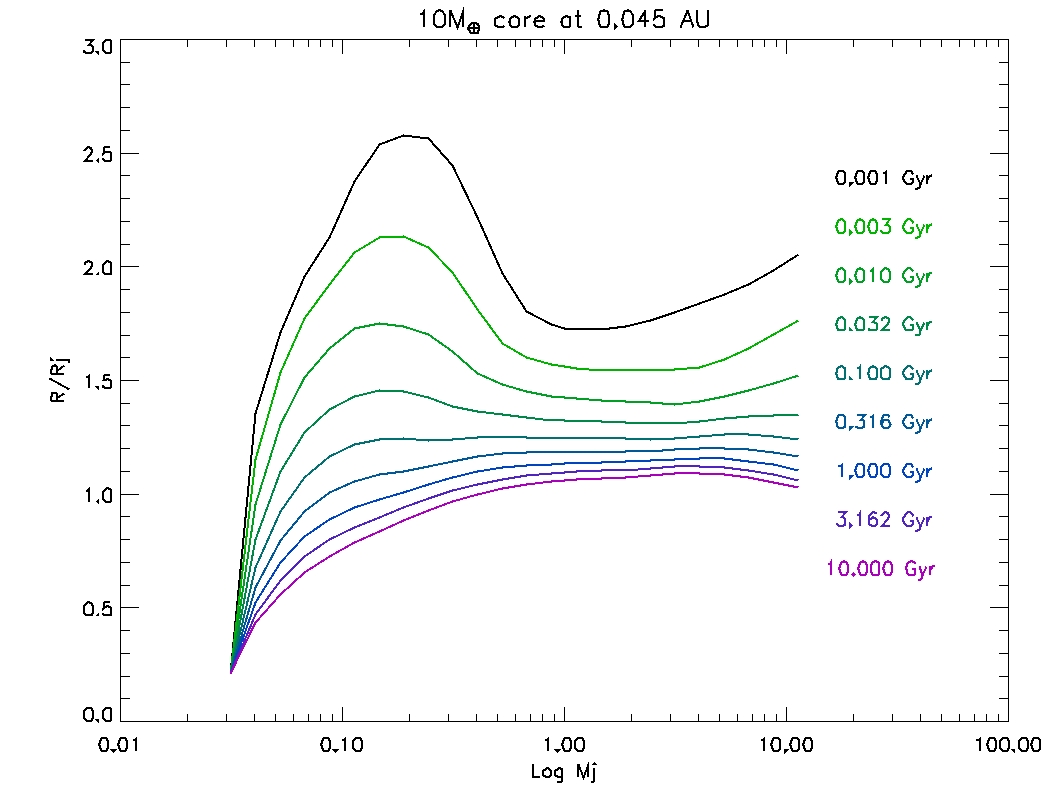
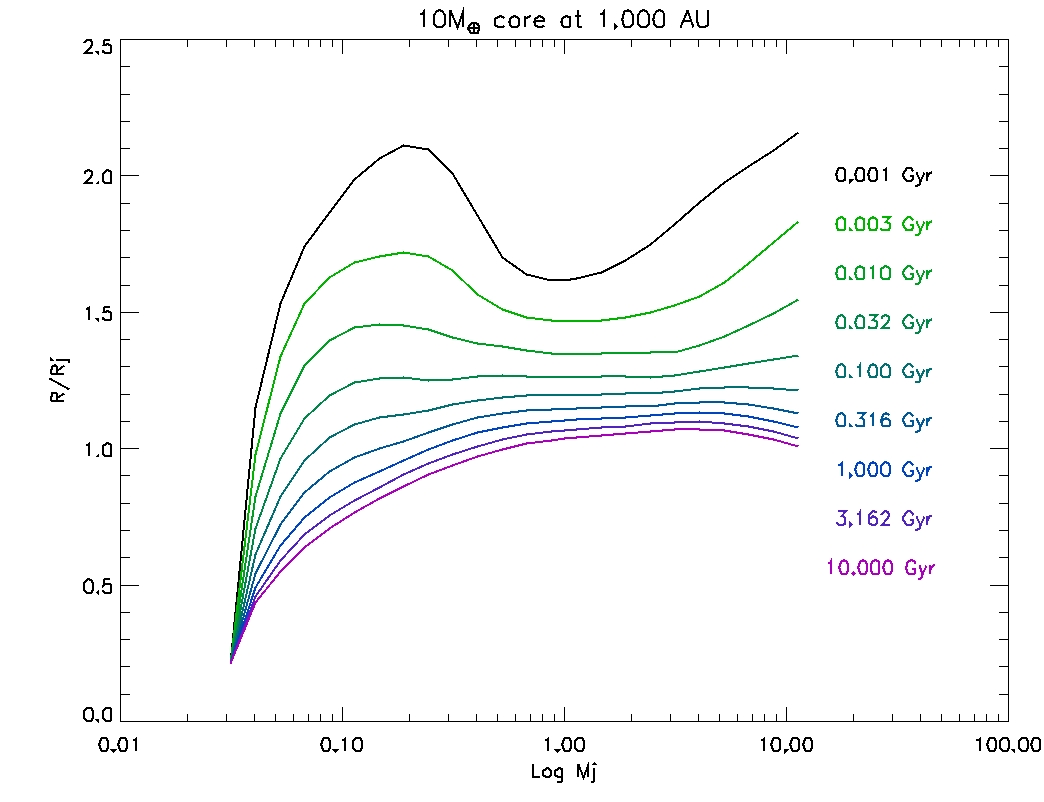
Models of Planetary Radii
These are tables that are interpolated from the giant planet thermal evolution models described in Fortney, Marley and Barnes (2007), Astrophysical Journal v. 659, 1661-1672. Models run from 1 Myr to 10 Gyr. Some very low mass young models are excluded from the tables, in particular at the highest irradiation levels. Planets are assumed to be at particular distances from the Sun, at constant level of the Sun's current luminosity. Heavy element cores, up to 100 Earth masses, are composed of a 50/50 mixture of ice and rock.For models for isolated, solar composition giant planets, and brown dwarfs, see the online models of Saumon & Marley (2008).
Tables:
0.02 AU -
0.045 AU -
0.1 AU -
1 AU -
9.5 AU -
Figures:
Mass vs. Radius -